GOVERNOR CUOMO ANNOUNCES RECORD-HIGH NUMBER OF COVID-19 TESTS REPORTED TO NEW YORK STATE FOR SECOND STRAIGHT DAY
219,442 Test Results Reported to New York State Yesterday
Positive Testing Rate in All Focus Zone Areas is 5.69 Percent; New York State Positivity Outside All Focus Zone Areas is 3.13 Percent
Statewide Positivity Rate is 3.72 Percent
39 COVID-19 Deaths in New York State Yesterday
Governor Andrew M. Cuomo today announced that 219,442 COVID-19 test results were reported to New York State yesterday—a new record high for the second straight day.
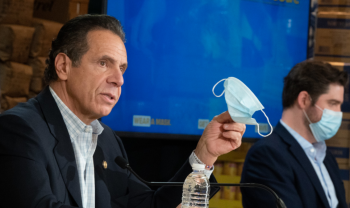
“All the global experts say the same thing: This virus has phases, and as the phase changes your plan should change. We’re seeing an increase with the numbers across the country and within our own state. It started with the fall, and it’s going to continue and probably worsen in the winter,” Governor Cuomo said. “As we go through the holidays and winter months, it’s going to be more imperative than ever for New Yorkers to wear their masks, wash their hands, avoid gatherings large and small, and stay New York Tough.”
The Governor noted that the positive testing rate in all focus areas under the state’s Micro-Cluster strategy is 5.69 percent, and outside the focus zone areas is 3.13 percent. Within the focus areas, 50,972 test results were reported yesterday, yielding 2,901 positives. In the remainder of the state, not counting these focus areas, 168,470 test results were reported, yielding 5,275 positives. Full results for tests reported yesterday, the day prior, the current 7-day rolling average, and last two weeks is below:
| STATEWIDE | 11/8- 11/14 % Positive | 11/15- 11/21 % Positive | Current 7-day rolling average | Day Prior (11/25) % Positive | Yesterday (11/26) % Positive | |
| All focus area statewide % positive | 4.81% | 4.51% | 4.74% | 4.90% | 5.69% | |
| Statewide % positive with all focus areas included | 2.86% | 2.89% | 3.17% | 3.18% | 3.72% | |
| Statewide % positive without all focus areas included | 2.47% | 2.44% | 2.70% | 2.68% | 3.13% |
Micro-cluster zone 7-day average positivity rates for today, yesterday, the day before, last week, and the week prior is below:
| FOCUS ZONE | 11/8- 11/14 % Positive | 11/15- 11/21 % Positive | Day Prior 7-day Rolling Average | Yesterday 7-day Rolling Average | Current 7-day Rolling average | |
| Erie orange-zone focus area % positive | 7.22% | 7.30% | 6.94% | 6.81% | 7.07% | |
| Erie Yellow-zone focus area % positive | 5.34% | 7.36% | 6.69% | 6.92% | 6.93% | |
| Niagara Yellow -zone focus area % positive | 5.10% | 4.44% | 5.56% | 6.14% | 6.90% | |
| Monroe Orange-zone focus area % positive | 4.41% | 4.17% | 4.72% | 4.99% | 5.46% | |
| Monroe Yellow-zone focus area % positive | 5.95% | 3.58% | 3.72% | 4.06% | 4.39% | |
| Onondaga Orange-zone focus area % positive | 6.26% | 5.34% | 4.91% | 4.95% | 4.62% | |
| Onondaga Yellow-zone focus area % positive | 6.03% | 4.50% | 4.23% | 4.23% | 4.01% | |
| Queens Kew Garden Hills/Forest Hills/Astoria yellow-zone focus area % positive | 3.40% | 3.40% | 3.15% | 3.25% | 3.39% | |
| Bronx East Yellow-zone focus area % positive | 3.81% | 3.52% | 3.84% | 4.27% | 4.48% | |
| Bronx West Yellow -zone focus area % positive | 3.80% | 4.70% | 4.55% | 4.55% | 4.43% | |
| Brooklyn Yellow-zone focus area % positive | 3.92% | 3.70% | 4.44% | 4.51% | 4.94% | |
| Rockland Yellow-zone focus area % positive | 3.55% | 3.39% | 3.03% | 3.25% | 3.53% | |
| Chemung Orange-zone focus area % positive | 4.59% | 4.71% | 5.19% | 5.68% | 5.92% | |
| Staten Island Orange-zone focus area % positive | 5.24% | 4.96% | 4.99% | 4.83% | 4.86% | |
| Staten Island Yellow-zone focus area % positive | 3.75% | 3.61% | 3.65% | 3.71% | 3.90% | |
| Tioga Yellow-zone focus area % positive | 10.81% | 5.60% | 2.95% | 2.52% | 2.67% | |
| Orange Middletown – Yellow-zone focus area % positive | 3.81% | 5.41% | 3.52% | 3.01% | 3.35% | |
| Orange Newburgh – Yellow-zone focus area % positive | 8.07% | 7.89% | 8.78% | 8.48% | 8.98% | |
| Manhattan-Washington Heights-Yellow-zone focus area % positive | 3.23% | 3.39% | 2.98% | 3.10% | 3.23% | |
| Nassau-Great Neck-Yellow-zone focus area % positive | 3.69% | 3.69% | 3.45% | 3.09% | 3.35% | |
| Nassau Massapequa Park -Yellow-zone focus area % positive | 4.64% | 4.15% | 3.78% | 3.97% | 4.88% | |
| Suffolk-Hampton Bays-Yellow-zone focus area % positive | 9.26% | 5.69% | 5.24% | 6.17% | 6.49% | |
| Suffolk-Riverhead-Yellow-zone focus area % positive | 4.80% | 4.85% | 4.34% | 3.90% | 3.84% | |
| Westchester Peekskill – Yellow-zone focus area % positive | 10.36% | 7.15% | 6.73% | 5.64% | 5.69% | |
| Westchester Ossining – Yellow-zone focus area % positive | 9.88% | 10.22% | 9.86% | 9.93% | 9.84% | |
| Westchester Tarrytown – Yellow-zone focus area % positive | 8.47% | 8.27% | 7.40% | 7.78% | 7.89% | |
| Westchester Yonkers – Yellow-zone focus area % positive | 4.48% | 4.11% | 4.32% | 4.35% | 4.85% | |
| Westchester New Rochelle – Yellow-zone focus area % positive | 6.46% | 5.68% | 4.99% | 5.75% | 5.80% | |
| Westchester Port Chester Orange-zone focus area % positive | 9.34% | 7.59% | 7.81% | 8.15% | 7.87% |
Today’s data is summarized briefly below:
- Patient Hospitalization – 3,103 (+47)
- Patients Newly Admitted – 471
- Hospital Counties – 54
- Number ICU – 636 (+8)
- Number ICU with Intubation – 294 (+8)
- Total Discharges – 84,723 (+384)
- Deaths – 39
- Total Deaths – 26,588
Each region’s percentage of positive test results reported over the last three days is as follows:
| REGION | TUESDAY | WEDNESDAY | THURSDAY | CURRENT 7-DAY AVERAGE |
| Capital Region | 2.4% | 3.1% | 3.7% | 2.64% |
| Central New York | 4.6% | 3.8% | 4.0% | 3.66% |
| Finger Lakes | 5.8% | 6.1% | 5.7% | 4.19% |
| Long Island | 4.0% | 3.3% | 3.8% | 3.47% |
| Mid-Hudson | 4.2% | 4.1% | 4.7% | 4.06% |
| Mohawk Valley | 5.0% | 3.3% | 3.6% | 3.42% |
| New York City | 2.7% | 2.4% | 2.8% | 2.56% |
| North Country | 3.3% | 2.1% | 2.9% | 2.35% |
| Southern Tier | 2.0% | 2.1% | 1.8% | 1.52% |
| Western New York | 6.6% | 5.6% | 8.1% | 6.28% |
Each New York City borough’s percentage of positive test results reported over the last three days is as follows:
| BOROUGH | TUESDAY | WEDNESDAY | THURSDAY | CURRENT 7-DAY AVERAGE |
| Bronx | 3.9% | 3.5% | 3.9% | 3.64% |
| Brooklyn | 2.5% | 2.2% | 2.8% | 2.42% |
| Manhattan | 1.5% | 1.5% | 1.7% | 1.60% |
| Queens | 3.0% | 3.1% | 3.3% | 2.89% |
| Staten Island | 4.6% | 3.6% | 4.4% | 4.07% |
Of the 628,375 total individuals who tested positive for the virus, the geographic breakdown is as follows:
| County | Total Positive | New Positive |
| Albany | 5,555 | 129 |
| Allegany | 983 | 53 |
| Broome | 5,201 | 58 |
| Cattaraugus | 1,058 | 61 |
| Cayuga | 822 | 28 |
| Chautauqua | 1,516 | 36 |
| Chemung | 2,955 | 83 |
| Chenango | 623 | 18 |
| Clinton | 448 | 5 |
| Columbia | 1,005 | 17 |
| Cortland | 979 | 22 |
| Delaware | 342 | 6 |
| Dutchess | 7,021 | 91 |
| Erie | 23,933 | 862 |
| Essex | 278 | 3 |
| Franklin | 259 | 4 |
| Fulton | 484 | 6 |
| Genesee | 932 | 42 |
| Greene | 675 | 14 |
| Hamilton | 42 | 0 |
| Herkimer | 645 | 14 |
| Jefferson | 500 | 13 |
| Lewis | 345 | 8 |
| Livingston | 671 | 16 |
| Madison | 898 | 20 |
| Monroe | 14,338 | 521 |
| Montgomery | 466 | 6 |
| Nassau | 59,238 | 671 |
| Niagara | 3,599 | 154 |
| NYC | 305,080 | 2,558 |
| Oneida | 4,655 | 140 |
| Onondaga | 10,248 | 224 |
| Ontario | 1,250 | 48 |
| Orange | 16,555 | 150 |
| Orleans | 604 | 6 |
| Oswego | 1,436 | 31 |
| Otsego | 596 | 9 |
| Putnam | 2,682 | 67 |
| Rensselaer | 1,666 | 41 |
| Rockland | 21,258 | 147 |
| Saratoga | 2,151 | 62 |
| Schenectady | 2,353 | 70 |
| Schoharie | 190 | 7 |
| Schuyler | 296 | 7 |
| Seneca | 276 | 7 |
| St. Lawrence | 784 | 41 |
| Steuben | 1,714 | 36 |
| Suffolk | 59,273 | 711 |
| Sullivan | 2,156 | 19 |
| Tioga | 1,095 | 15 |
| Tompkins | 1,043 | 43 |
| Ulster | 3,238 | 58 |
| Warren | 571 | 2 |
| Washington | 440 | 1 |
| Wayne | 1,083 | 31 |
| Westchester | 49,102 | 661 |
| Wyoming | 517 | 18 |
| Yates | 252 | 5 |
Yesterday, 39 New Yorkers died due to COVID-19 in New York State, bringing the total to 26,588. A geographic breakdown is as follows, by county of residence:
| Deaths by County of Residence | |
| County | New Deaths |
| Albany | 4 |
| Bronx | 1 |
| Broome | 2 |
| Chemung | 1 |
| Erie | 6 |
| Kings | 3 |
| Manhattan | 1 |
| Monroe | 3 |
| Niagara | 2 |
| Oneida | 3 |
| Onondaga | 1 |
| Orange | 2 |
| Orleans | 1 |
| Queens | 1 |
| Richmond | 2 |
| Rockland | 1 |
| Saratoga | 1 |
| Schenectady | 1 |
| Tioga | 1 |
| Westchester | 2 |
###
Additional news available at www.governor.ny.gov
New York State | Executive Chamber |[email protected] | 518.474.8418