GOVERNOR CUOMO UPDATES NEW YORKERS ON STATE’S PROGRESS DURING COVID-19 PANDEMIC
8,561 Patient Hospitalizations Statewide
1,068 Patients in the ICU; 912 Intubated
Statewide Positivity Rate is 7.72%
161 COVID-19 Deaths in New York State Yesterday
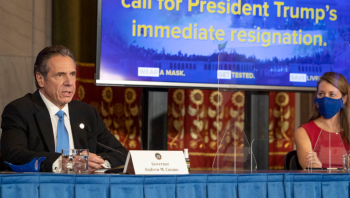
Governor Andrew M. Cuomo today updated New Yorkers on the state’s progress during the ongoing COVID-19 pandemic.
“We know these numbers and we know what is happening. This is all predictive. You have the holidays, socialization, holiday spread and the number goes up. We’ve said that since before Thanksgiving, and we said celebrate smart and stop the spread. Social gatherings happened and the infection rate went up. Slowing the spread depends on your behavior, and your belief in your community. You resolve community spread when the community acts differently,” Governor Cuomo said. “We are in a footrace between how fast the infection rate goes up and how fast the vaccination rate goes up. I am telling you, we are in a danger zone. The infection and hospitalization rates are going up quickly, and when the hospitalization rate goes up, the hospitals reach capacity and the economy shuts down. Add to that footrace a new factor: the UK strain. The UK strain is here and it’s spreading. This is the Usain Bolt of infection rates and it is frightening.”
Today’s data is summarized briefly below:
- Test Results Reported – 243,903
- Total Positive – 18,832
- Percent Positive – 7.72%
- Patient Hospitalization – 8,561 (+13)
- Patients Newly Admitted – 1,068
- Hospital Counties – 56
- Number ICU – 1,475 (+51)
- Number ICU with Intubation – 912 (+53)
- Total Discharges – 108,144 (+901)
- Deaths – 161
- Total Deaths – 31,329
The total number of New Yorkers who have received the first COVID-19 vaccine dose to date is as follows:
| Week | Doses Administered |
| Week 1 (12/14 – 12/20) | 33,709 |
| Week 2 (12/21 – 12/27) | 102,190 |
| Week 3 (12/28 – 1/3) | 148,165 |
| Week 4 so far (1/4 -) | 195,078 |
| TOTAL | 479,142 |
The regional hospital bed capacity and occupancy numbers, including the number of hospitalizations as a percent of the region’s population, is as follows:
| Region | COVID Patients Currently in Hospital in Region | COVID Patients as Percent of Region Population | Regional Hospital Bed Capacity |
| Capital Region | 515 | 0.05% | 22% |
| Central New York | 374 | 0.05% | 24% |
| Finger Lakes | 905 | 0.08% | 30% |
| Long Island | 1552 | 0.05% | 27% |
| Mid-Hudson | 980 | 0.04% | 38% |
| Mohawk Valley | 321 | 0.07% | 23% |
| New York City | 3066 | 0.04% | 32% |
| North Country | 106 | 0.03% | 48% |
| Southern Tier | 212 | 0.03% | 41% |
| Western New York | 530 | 0.04% | 31% |
| Statewide | 8561 | 0.04% | 31% |
The regional ICU bed capacity and occupancy numbers are as follows:
| Region | Total ICU Beds in Region | Total Occupied ICU Beds in Region | Percent of ICU Beds Available in Region (7-Day Average) |
| Capital Region | 254 | 203 | 17% |
| Central New York | 266 | 189 | 27% |
| Finger Lakes | 397 | 302 | 24% |
| Long Island | 860 | 714 | 19% |
| Mid-Hudson | 703 | 431 | 40% |
| Mohawk Valley | 127 | 104 | 20% |
| New York City | 2458 | 1880 | 26% |
| North Country | 63 | 42 | 35% |
| Southern Tier | 127 | 81 | 36% |
| Western New York | 544 | 352 | 37% |
| NYS TOTAL | 5799 | 4298 | 27% |
Each region’s 7-day average percentage of positive test results reported over the last three days is as follows:
| REGION | TUESDAY | WEDNESDAY | THURSDAY |
| Capital Region | 10.07% | 10.04% | 10.16% |
| Central New York | 9.13% | 8.51% | 8.57% |
| Finger Lakes | 10.29% | 10.09% | 10.22% |
| Long Island | 9.52% | 9.51% | 9.68% |
| Mid-Hudson | 8.18% | 8.21% | 8.12% |
| Mohawk Valley | 10.67% | 10.38% | 10.80% |
| New York City | 6.39% | 6.38% | 6.42% |
| North Country | 9.19% | 8.80% | 8.45% |
| Southern Tier | 5.56% | 5.55% | 5.30% |
| Western New York | 8.76% | 8.46% | 8.61% |
| Statewide | 7.92% | 7.85% | 7.88% |
Each New York City borough’s 7-day average percentage of positive test results reported over the last three days is as follows:
| BOROUGH | TUESDAY | WEDNESDAY | THURSDAY |
| Bronx | 7.48% | 8.18% | 8.21% |
| Brooklyn | 6.38% | 6.65% | 6.70% |
| Manhattan | 3.98% | 4.30% | 4.45% |
| Queens | 7.47% | 7.50% | 7.49% |
| Staten Island | 7.82% | 7.97% | 7.84% |
Of the 1,094,144 total individuals who tested positive for the virus, the geographic breakdown is as follows:
| County | Total Positive | New Positive |
| Albany | 13,697 | 287 |
| Allegany | 2,066 | 51 |
| Broome | 9,459 | 195 |
| Cattaraugus | 2,925 | 89 |
| Cayuga | 3,707 | 118 |
| Chautauqua | 4,427 | 240 |
| Chemung | 5,038 | 94 |
| Chenango | 1,430 | 37 |
| Clinton | 1,556 | 56 |
| Columbia | 1,953 | 47 |
| Cortland | 2,340 | 51 |
| Delaware | 838 | 28 |
| Dutchess | 13,923 | 281 |
| Erie | 46,109 | 1,032 |
| Essex | 778 | 62 |
| Franklin | 886 | 34 |
| Fulton | 1,567 | 58 |
| Genesee | 3,199 | 61 |
| Greene | 1,674 | 50 |
| Hamilton | 128 | 4 |
| Herkimer | 2,862 | 112 |
| Jefferson | 2,348 | 103 |
| Lewis | 1,147 | 30 |
| Livingston | 2,259 | 64 |
| Madison | 2,682 | 80 |
| Monroe | 38,849 | 796 |
| Montgomery | 1,742 | 109 |
| Nassau | 99,439 | 1,693 |
| Niagara | 10,098 | 292 |
| NYC | 466,804 | 6,284 |
| Oneida | 14,396 | 322 |
| Onondaga | 24,316 | 552 |
| Ontario | 4,036 | 136 |
| Orange | 25,683 | 429 |
| Orleans | 1,629 | 77 |
| Oswego | 4,099 | 124 |
| Otsego | 1,360 | 25 |
| Putnam | 5,551 | 115 |
| Rensselaer | 5,440 | 191 |
| Rockland | 29,444 | 242 |
| Saratoga | 7,303 | 276 |
| Schenectady | 7,118 | 166 |
| Schoharie | 701 | 22 |
| Schuyler | 622 | 18 |
| Seneca | 982 | 17 |
| St. Lawrence | 2,803 | 104 |
| Steuben | 3,995 | 105 |
| Suffolk | 110,209 | 1,954 |
| Sullivan | 3,418 | 48 |
| Tioga | 1,940 | 39 |
| Tompkins | 2,318 | 40 |
| Ulster | 6,557 | 140 |
| Warren | 1,567 | 80 |
| Washington | 1,115 | 61 |
| Wayne | 3,129 | 100 |
| Westchester | 76,089 | 913 |
| Wyoming | 1,745 | 72 |
| Yates | 649 | 26 |
Yesterday, 161 New Yorkers died due to COVID-19 in New York State, bringing the total to 31,329. A geographic breakdown is as follows, by county of residence:
| Deaths by County of Residence | |
| County | New Deaths |
| Albany | 2 |
| Bronx | 7 |
| Broome | 3 |
| Cattaraugus | 3 |
| Cayuga | 1 |
| Chemung | 2 |
| Chenango | 2 |
| Clinton | 1 |
| Dutchess | 3 |
| Erie | 19 |
| Fulton | 1 |
| Genesee | 5 |
| Greene | 2 |
| Jefferson | 1 |
| Kings | 13 |
| Madison | 1 |
| Manhattan | 1 |
| Monroe | 14 |
| Nassau | 10 |
| Niagara | 5 |
| Oneida | 1 |
| Onondaga | 12 |
| Orange | 5 |
| Oswego | 2 |
| Otsego | 3 |
| Putnam | 1 |
| Queens | 14 |
| Richmond | 4 |
| Saratoga | 2 |
| Schenectady | 1 |
| Seneca | 1 |
| Suffolk | 12 |
| Sullivan | 1 |
| Ulster | 4 |
| Westchester | 2 |
###
Additional news available at www.governor.ny.gov
New York State | Executive Chamber |[email protected] | 518.474.8418