
Fiscal Frameworks for New York State Government

Introduction
Observing the New York State Budget from outside government this spring for the first time in many years made me think more about the various fiscal frameworks under which the State and other governments operate. By “fiscal frameworks,” I’m referring to two different types of frameworks. The first is a framework of limitations on government spending (or borrowing) as a whole or within a particular sector. The second type of framework is essentially the opposite – i.e., a funding formula that requires the government to spend an amount determined by the funding formula, irrespective of broader fiscal limitations.
The executive branch, which has the primary responsibility for achieving a balanced budget, generally prefers limitation frameworks that establish predictable criteria for the amount of funding needed for certain sectors. This is true not only because it makes their lives easier in getting to a balanced Budget, but because agreement on such a framework has the effect of forcing the legislature to explicitly establish the relative priority of various spending categories in the Budget.
On the other hand, stakeholders and their legislative supporters want funding to be based on a bottom-up determination of “need” in particular sectors. They reject the framing of the issue that meeting the “need” in a particular area must result in spending reductions in other sectors. The challenge with this philosophy is that, viewed in isolation, the “need” for spending on progressive programs is practically infinite.
The FY 25 Budget enacted by the governor and the legislature two weeks ago represents progress in a number of areas. At the same time, however, the FY 25 Budget reflects a further departure from the fiscal frameworks that limited spending under most of Gov. Andrew Cuomo’s time in office. The fiscal frameworks that guided State spending for roughly a decade have largely been swept aside. There is no longer a target for growth in State Operating Funds spending. The Medicaid Global Cap survives in law, but the exceptions now almost swallow the rule. The School Aid Growth Cap has been replaced by a restoration of the Foundation Aid formula, which dictates a given level of spending that is higher than the amount that would have been permitted under the School Aid Growth Cap.
The absence of a fiscal framework creates two types of risk. The first risk is that in the absence of a compelling need to make difficult decisions, excess revenue will be frittered away on near-term consumption rather than invested in longer-term plans that can buy down future operating expenses and are likely to have a larger programmatic impact. The second risk is that the recent trend of spending growth is unlikely to be sustainable based on revenue growth alone, even with the continuation of the FY 22 “high earner” surtax, which increased the share of New York State Personal Income raised by State taxes to historically high levels. If New York creates “temporary” surcharges every time it hits a financial crisis and then makes them permanent, at some point, it will affect the competitiveness of the State in a material way.
The closeout of FY 24 actual spending and forecasted FY 25 spending in certain areas isn’t available until the FY 25 Enacted Budget Report is released, which typically occurs about four weeks after the final Budget is voted on.[1] Nevertheless, enough information is public through the official FY 25 Budget press release that we can develop reasonably good estimates of the spending growth reflected in the FY25 Enacted Budget over spending levels in FY 24.
The FY 25 Enacted Budget’s All Funds spending of $237 billion represents annual growth of approximately 2.5% over FY 24. The FY 25 Enacted Budget press release does not disclose the amount of State Operating Funds spending, but we estimate that the growth in State Operating Funds will be in the neighborhood of 6% over FY 24.[2]
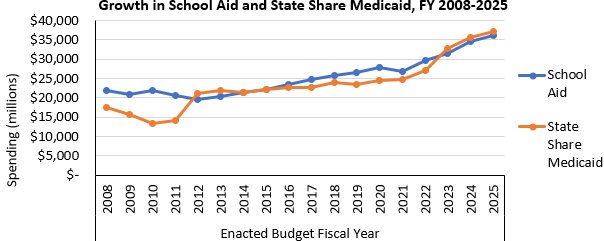
The two largest categories of State Operating Funds spending are School Aid and the State share of Medicaid, each of which accounts for roughly a quarter of total State Operating Funds spending. School Aid in the FY 25 Budget grew by approximately 4.6%. The reported rate of growth in the total State share of Medicaid spending is expected to be approximately 2.3%. This figure is accurate but somewhat misleading in terms of the trend of Medicaid spending. State share Medicaid spending in FY 24 was inflated by the delay in reimbursement of $950 million of State advances of the Federal share of Directed Payment Template (DPT) funds for financially distressed hospitals and FY 25 spending is reduced by the same amount. Adjusted for this timing difference, the State share of Medicaid in the FY 25 Enacted Budget would be close to 9% above FY 24 adjusted spending.
Education and healthcare stakeholders watch each other’s spending growth like hawks. As reflected in the chart below, the level and growth in spending in these two categories has remained very close over the last 15 years.
I don’t want the Step Two Policy Project to be viewed as a “budget scold” that reflexively regards more spending as bad and less spending as good. I know how hard it is to find the right balance between immediate spending needs and long-term fiscal strength. The FY 25 Budget and other recent budgets may reflect exactly the right policy choices under our current fiscal circumstances.
It’s important to examine Budget issues not just on a year-to-year basis but within the context of a longer-term fiscal strategy. To some extent, the FY25 Executive Budget seemed to acknowledge the importance of looking at spending growth over multiple years by highlighting the 32% growth in major parts of the Budget over the last three years and citing the “unsustainable” growth in both long term care and support for financially distressed hospitals.[3] But the Enacted Budget press release greeted decisions to spend even more in these areas as “historic investments”, with structural changes that would bend the spending curve promised in the future.
Part of my thinking about fiscal frameworks was influenced by living in London this spring and realizing the much greater degree to which the United Kingdom operates within a comprehensive fiscal framework that is well understood by the press and public, accepted by both major political parties, and which serves as the central organizing principle for fiscal decision-making. The concept of there being a limited amount of “headroom” for tax cuts or spending increases that is available based on official fiscal forecasts is accepted as being dispositive on the issue rather than the opening gambit in a negotiation.
At the core of the U.K.’s fiscal framework is a set of rules, including the current budget rule that requires balancing the government’s current budget over a rolling three-year period, and a debt rule, which targets a reduction in the public sector net-debt-to-GDP ratio over a five-year period.[4],[5] The U.K.’s Office for Budget Responsibility (OBR) analyzes the government’s performance against these fiscal rules, projects future performance, and reports on both publicly. The Charter for Budget Responsibility codifies the government’s approach to fiscal policy, including particular rules, and provides guidance for the OBR.
Beyond these high-level fiscal rules are various spending controls and limits, including the Treasury’s fixed, multi-year spending caps for individual government departments known as “departmental expenditure limits” (DELs) and annually managed expenditure (AME)— for categories of spending less suited to mid- and long-term planning.[6] There is a specific spending cap on “welfare” that covers certain categories of social security and income support programs.[7]
Some would say that the United Kingdom is a case study for the proposition that a clear and disciplined fiscal framework that limits spending does not guarantee good policy results, but I am too much of a rationalist to think that New York State would not benefit from a more explicit set of fiscal frameworks than are in force today.
Fiscal Frameworks and Spending Growth in New York from FY 2008 To FY 2025
The major fiscal frameworks in New York State in recent times have included the following: (i) the requirement of a balanced budget under the New York State Constitution; (ii) Gov. Andrew Cuomo’s policy guideline that annual growth in State operating funds spending be limited to 2.0%; (iii) Gov. Kathy Hochul’s policy emphasis on maintaining a high level of budget reserves; (iv) the Medicaid Global Cap; (v) the School Aid Growth Cap and the Foundation Aid formula in School Aid; and (vi) the statutory debt cap.
State Constitutional Requirement of a Balanced Budget
It is a commonplace understanding that the New York State Constitution requires the State to enact a balanced budget. Unlike statutory fiscal frameworks, the constitutional requirement of a balanced budget cannot be ignored (or “notwithstood” in budget parlance) in the annual budget making process. The specific requirements about a balanced budget in the New York State Constitution, however, are less well understood and less prescriptive than one might think.
Article VII of the New York State Constitution[8] states that:
“[T]he governor shall submit to the legislature a budget containing a complete plan of expenditures proposed to be made before the close of the ensuing fiscal year and all moneys and revenues estimated to be available therefor, together with an explanation of the basis of such estimates and recommendations as to proposed legislation, if any, which the governor may deem necessary to provide moneys and revenues sufficient to meet such proposed expenditures.” (Emphasis added)
New York State Finance Law Section 22[9] sets forth quite detailed requirements regarding the presentation of information concerning the Budget. The prescriptions about reporting generally refer to General Funds and Special Revenue Funds, which have become anachronistic concepts since 2008 when the Division of the Budget created the construct of State Operating Funds.[10]
In addition, although Section 22 requires the Division of the Budget to report “expenditures estimated to be made in accordance with generally accepted accounting principles (GAAP), the Constitutional requirement and most of the reporting requirements in Section 22 are interpreted to be based on “cash” accounting rather than the accrual accounting required under GAAP. Cash accounting provides more flexibility than GAAP accrual accounting in achieving a balanced budget because the Executive has significant control over the timing of expenditures.
The State Constitutional requirement only applies to the budget that the governor must submit to the legislature. There actually is no constitutional requirement that the legislature and the executive enact a balanced budget.[11] As a practical matter, however, the Budget is considered to be completed and deemed balanced when appropriation bills are passed by the legislature pursuant to which estimated revenues (including the use of reserves) for the upcoming fiscal year are at least equal to General Funds expenditures on a cash basis during that fiscal year.
Gov. Andrew Cuomo’s 2% Growth in State Operating Funds Guideline
Gov. Andrew Cuomo saw the advantages of establishing fiscal frameworks that would limit the growth of spending in the Budget and set parameters for growth in the two largest categories of spending– Medicaid and School Aid.
Upon taking office in 2011, Gov. Cuomo proposed, and the legislature enacted a local property tax spending cap of 2% outside of New York City, which could only be overridden by a two-thirds vote of the electorate of the particular taxing body, whether it was a school district, village, or county. Gov. Cuomo wanted to send a message that State government would live within the same constraints, so he established a nonbinding policy guideline that growth in State Operating Funds spending would not exceed 2% a year.The statutory 2% local property tax cap has remained in effect and is only rarely overridden in a special vote. This has doubtless constrained local spending, but because the cost of services grows more than 2% annually, the local property tax cap has also had the effect of shifting costs to State government to make up the difference.
The table at right shows actual State Operating Funds spending and growth rates from FY 2012 (Governor Cuomo’s first Budget) through FY 2023, along with estimated State Operating Funds spending for FY 2024[12] and the forecasted spending in the FY 2025 Enacted Budget.
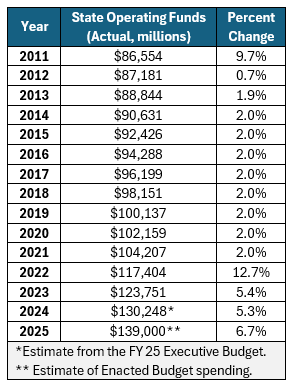
As shown in the table, Gov. Cuomo was able to adhere to his self-imposed 2% cap on State Operating Funds growth until his last budget in FY 22. Critics would occasionally quibble that the reported numbers might not always reflect the economic reality and that the “true” growth rate in a given year might have been around 3%. For example, State Operating Funds spending on Medicaid in FY 20 was reduced by approximately $1.7 billion that was “rolled” into the following fiscal year because of an unexpected surge in Medicaid costs. But with small exceptions like these, there is no doubt that during those years the 2% spending cap was the organizing principle of the budget and significantly constrained State spending.
In FY 22, that constraint was released, and the Enacted Budget increased State Operating Funds spending by 7.7%. With Gov. Cuomo out of office as of August 2021, there was less of an imperative to control spending during that fiscal year than there otherwise might have been. Actual State Operating Funds spending in FY 22 increased by 12.7%. Two factors help explain what happened in the FY 22 Budget. First, the State experienced a windfall in revenue from Covid-19-related spending and the implementation of “temporary” surcharges on high earners and business taxes; and second, Gov. Cuomo was weakened in his negotiations with the legislature by the controversies that ultimately led to his resignation.
Budget making is all about trade-offs, and Gov. Cuomo’s 2% State Operating Funds limitation was no exception. Gov. Cuomo famously said that “New York has no future as a high tax state.” By limiting growth in State Operating Funds spending to 2%, Gov. Cuomo was able to maintain or reduce tax rates to a greater extent than would have been possible if the State were expanding spending to essentially match the growth in revenue. Taxpayers may be one of the weakest stakeholder groups in Albany, but taxes are among the paramount issues for voters, and restraining taxes was a priority for Gov. Cuomo.
The trade-off from the 2% spending cap was that underlying program “need” – which, as noted above, is essentially infinite in a progressive state like New York – was always greater than 2%. Constraining spending has real-world implications on the availability of funding for programs as well as on the capacity for agency operations. Funding for agency operations was generally held flat during those years. As described below, Gov. Cuomo contemplated annual increases of approximately 4% for School Aid and approximately 3% for Medicaid, which arithmetically meant that spending in all other areas of the Budget needed to be kept flat to achieve the 2% overall spending limit.
Was this the right trade-off? The reconciling principle in the Cuomo administration was intended to be that the State would find efficiencies to address unmet need, but that is an imperfect process and one that is often thwarted by political reality. For a progressive, reducing taxes rather than spending more in the face of unmet programmatic need is difficult. Moreover, in any given year, the benefit of reducing taxes for individual families and on the competitiveness of the State as a whole is small. Cumulatively, however, the relationship between the tax burden on the cost of living and the economic competitiveness of the State becomes important.
At the federal level, tax burden is usually measured as a percentage of gross domestic product (GDP). At this State level, I think the most meaningful measure of tax burden is the amount of State tax revenue as a percent of Personal Income. [13] As shown in the table below, that amount, which had averaged 6.2% from 2007 through 2021 reached 7.2% in 2023, the most recent year for which official data is available, primarily as a function of the surtax on High Earners enacted in the FY 22 Budget and which was continued in the FY 25 Budget.[14]

Gov. Kathy Hochul’s Policy Guideline Regarding Budgetary Reserves
Gov. Hochul never embraced the 2% growth target for State Operating Funds growth. Based on FY 23 actual spending, the FY 25 Executive Budget estimate of FY 24 spending, and our estimate of the FY 25 Enacted Budget spending, the State Operating Funds growth in her three Budgets has averaged approximately 5.8%.[15] What made this possible is that actual revenue in the immediate post-pandemic period was much higher than was forecasted in the FY 22 Budget when the “high earner” surtax was enacted. The FY 22 Budget, which was enacted in April 2021, forecasted total revenue of $ 89.7 billion in FY 22 and $ 96.1 billion in FY 23. Actual revenue during those years was $104.7 billion in FY 22 and $113.7 billion in FY 23. This windfall enabled Gov. Hochul to meet most (though certainly not all) of the spending demands of stakeholders and the legislature and still maintain Budget reserves at an unprecedented level.
As reflected in the chart below, reproduced from the FY25 Executive Budget Financial Plan, the Hochul administration has highlighted the level of “Principal Reserves,” which are five times higher than in FY 20, notwithstanding the fact that State Operating Funds Spending growth between FY 20 and FY 25 has increased by 36%, or a compound annual growth rate of approximately 5.3%.
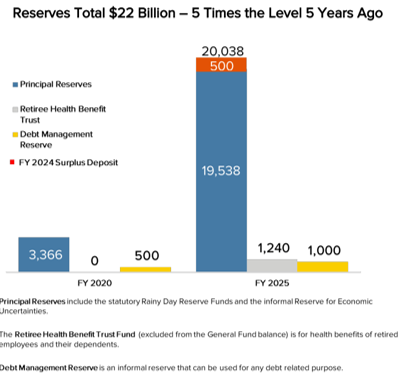
Chart from p. 17: https://www.budget.ny.gov/pubs/archive/fy25/ex/fp/fy25fp-ex.pdf
Implicitly, at least, Gov. Hochul has replaced the fiscal framework of holding the growth in State Operating Funds spending to a certain percentage with a framework that limits spending to the amount of revenue available without further increasing taxes (beyond the FY 22 surtax on High Earners) so long as financial reserves are maintained at a high level relative to historical standards.
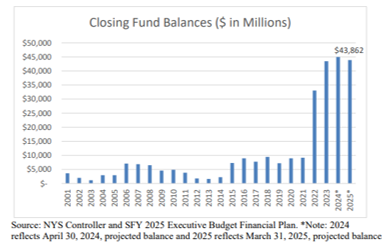
A presentation by the Greater New York Hospital Association that includes reserves related to timing differences shows the extent to which total Budget reserves are at historically high levels.

Although maintaining large Budget reserves protects the State in the event of a severe fiscal shock, the experience of both the 2008 financial crisis and the Covid-19 pandemic is that the federal government provides significant supplemental support in the event of severe fiscal shocks. The disadvantage of maintaining historically high reserves is that their existence creates inexorable pressure on short-term spending. Many states have responded to the unexpected surge in revenue post-pandemic by reducing taxes, a strategy New York did not pursue. In my view, the best strategy would be to dedicate the portion of reserves above historical levels to investment programs, such as the Safety Net Hospital Transformation Fund, which promise to reduce future operating expenses and which cannot succeed without substantial investment.
The Medicaid Global Cap
Before discussing the fiscal framework for Medicaid, we should describe the various ways in which Medicaid spending is reported the Budget. All Funds Medicaid spending sometimes includes expenditures of the Essential Plan in Medicaid spending and sometimes does not. More pertinent to the discussion here, the Budget reports State share spending on Medicaid in three different ways and rarely explains the distinctions.
For example, the FY 25 Executive Budget presentation, Financial Plan, and Briefing Book are all based on “DOH-only Medicaid” of $30.9 billion,[16] and highlighted the fact that such spending was growing by 10.9% in the FY 25 Executive Budget even after $1.2 billion in savings actions. However, the Enacted Budget press release did not address “DOH-only Medicaid” but instead reported on total State share spending on Medicaid, which was $37 billion. The third way in which State share spending on Medicaid reported is the Medicaid Global Cap, which is a subset of DOH-only Medicaid with a number of spending categories excluded from the formula.
To a greater degree than any other part of the Budget, the growth in Medicaid spending is often distorted by the timing differences that would be smoothed out in GAAP accrual accounting but not in the cash method of accounting the Budget uses, as well as enhanced federal funding, which is often channeled through the Medicaid program but only part of which is used for Medicaid spending.
Reporting on Medicaid spending in the Budget has become a Tower of Babel. It is not only the public but senior policymakers who get confused by the different ways in which Medicaid is reported in the Budget. All concerned would benefit if the Division of the Budget would consistently report on the “true growth” of Medicaid that included all State share Medicaid spending, identified expenditures such as the State takeover of the local share of Medicaid and minimum-wage expenses that are not part of the Medicaid Global Cap but are part of total State share spending on Medicaid, and addressed the impact of timing differences.
The Medicaid Global Cap was one of Gov. Andrew Cuomo’s most significant policy achievements in his first year in office. The Medicaid Global Cap was designed with a twofold purpose. The first objective was to create consensus among stakeholders around a targeted growth rate for Medicaid, with the goal of ending a dedicated battle against the sitting governor waged by the hospitals and their labor allies. The second purpose, which is rarely discussed because it has never been used, was to create statutory “superpowers” that authorized the Department of Health to unilaterally impose a “savings plan” if Medicaid spending was trending to a level in excess of the Medicaid Global Cap, thereby disintermediating the power of the legislature—at least in theory.
The Medicaid Global Cap limited the growth in the State share of Medicaid spending to the ten-year average rate of medical CPI, which was approximately 3% at the time. For reasons shrouded in the mists of time, the Medicaid Global Cap did not apply to Medicaid spending outside of DOH (through the “O” agencies – OASAS, OMH, and OPWDD). At this point, excluding non-DOH Medicaid spending is more a matter of bureaucratic convenience (reflecting separate Budget units for DOH and the “O” agencies) than a matter of programmatic logic.
Basing the Medicaid Global Cap on medical CPI was always a problematical construct for two reasons: first, medical CPI reflects increases in the price of services and does not capture increases in the utilization of services; second, the Medicaid Global Cap was not adjusted for increases in enrollment in Medicaid. Nevertheless, large increases in the federal share of Medicaid in the years following the adoption of the Affordable Care Act enabled the state to accommodate significant growth in program spending while still holding State share spending to the limits imposed by the Medicaid Global Cap. Over the years, further flexibility in spending was accomplished by excluding items from the Medicaid Global Cap calculation, such as the impact of the State takeover of the growth in the local share of Medicaid and the impact on Medicaid spending of increases in the minimum wage.
In FY 23, the Medicaid Global Cap index for determining future growth was changed from the ten-year average of the medical CPI to the five-year rolling average of Medicaid spending projections within the National Health Expenditure Accounts produced by the Office of the Actuary in the Centers for Medicare & Medicaid Services. Critically, this measure incorporates increased utilization in the index and increases the allowable growth in the Medicaid Global Cap from approximately 3% annually to approximately 5.5% annually. As noted in the FY 25 Executive Budget Briefing Book, this change in the Medicaid Global Cap index permits “$15.6 billion in additional Medicaid spending growth between FY 2024 and 2028 as compared to the prior Global Cap growth metric.”[17]
Although the legislature has agreed to maintain the Medicaid Global Cap in the FY 25 Budget, it reduced appropriation authority from a two-year period to a one-year budget. This may seem very much like inside baseball, but the two-year construct both better reflects reality and enables at least medium-term planning of Medicaid spending. Because the Medicaid Global Cap has been modified so frequently over the years to accommodate higher spending, its ability to define the limits of growth of Medicaid spending has almost vanished.
The Medicaid Global Cap would better serve as a framework to guide spending if it were formulated in a way that reflected the totality of State share spending on Medicaid. Although the growth index for the Medicaid Global Cap has changed, the Medicaid Global Cap still covers DOH-only Medicaid spending and, even within that category, contains carveouts for large amounts of Medicaid spending, including the State takeover of the growth in the local share of Medicaid spending, the effective minimum wage, and (with the FY 25 Budget) State share spending in connection with the MCO tax.[18]
A revised Medicaid Global Cap should also establish parameters around particular categories of spending, including primary care, reimbursement of hospitals, and long-term care. Without such parameters, long-term care will continue to crowd out not only spending from other sectors of the overall Budget but also within the Health budget itself.
Indeed, the phenomenon of Medicaid spending crowding out all other sectors of the budget was a large part of the motivation for the creation of the Medicaid Global Cap in 2011. If you extrapolate the trend of total State share of Medicaid spending growth over the last five years, which is approximately 10.5%, to the next five years, Medicaid spending would increase by $68 billion to approximately $207 billion, which is approximately $35 billion higher than it would be if growth were limited to the approximately 5.5% rate of growth of the current Medicaid Global Cap index. This level of Medicaid growth would undoubtedly crowd out spending in other areas.
The charts and tables below show the growth in Medicaid from FY 12 (the first year of the Medicaid global cap) through FY 25. The All Funds spending total is based on the FY 24 Exectuvie Budget Briefing Book, adjusted for the updated estimate of FY 24 actual spending. The All Funds figures exclude spending under the Essential Plan, which DOB sometimes includes in reporting All Funds Medicaid spending for legacy reasons, even though it is not Medicaid.
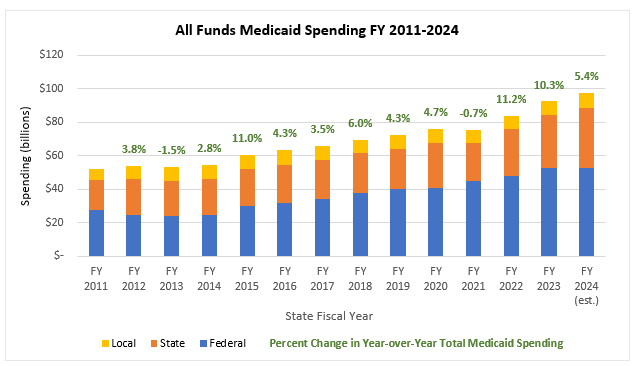
The chart below shows the year-over-year increase in total State share Medicaid spending, as reported by DOB, and as estimated for FY 24 and forecasted for FY 25.

Year-over-year growth data in Medicaid spending can be misleading, mostly due to accounting anomalies such as the timing of payments. As noted above, if the FY 24 and FY 25 data were adjusted for the timing of reimbursement of State advances of DPT payments to financially distressed hospitals, the growth rates would be an estimated 8.8% in FY 24 and approximately 9.6% in FY 25. Year-over-year Medicaid spending may also be affected by extraordinary factors such as the Covid-19 lockdown, which significantly reduced utilization of healthcare services during 2020 and suppressed spending in FY21. For that reason, it is more meaningful to examine the compound annual growth rate (CAGR) of State share Medicaid spending in five-year cohorts – 2011-2015, 2016-2020, and 2021-2025.

The Foundation Aid Formula in School Aid
The “Foundation Aid” formula for School Aid was an outgrowth of a long-running lawsuit by an organization called the Campaign for Fiscal Equity that maintained that the courts could identify a funding formula necessary to achieve the New York State constitutional requirement that the State provide all students with “a sound basic education.” Although the Court of Appeals had ruled in late 2006 that the State had already met this requirement, as a matter of policy, the Spitzer administration engaged with advocates to develop such a formula, which became known as the “Foundation Aid” formula.
The Foundation Aid formula determines the level of a majority of State aid to particular school districts predicated upon an estimated base cost of providing a sound basic education to a typical student, adjusted by a “pupil needs index” (such as poverty or the number of English language learners), a regional cost index, and the district’s ability to raise funding for education through its property tax based on local property wealth and income data (i.e., the “combined wealth ratio”). The balance of School Aid is called Expense-Based aid, which represents reimbursement for specific categories of expense, including payment of debt service on school-based capital.
The basic parameters of the Foundation Aid formula were developed by Tony Shorris (who later became First Deputy Mayor under Bill de Blasio) on behalf of the Spitzer transition team. It was introduced in the FY 08 Executive Budget when I was the Budget Director. The legislation included a number of progressive elements designed to target aid not only on high-need school districts but on the highest-need schools within those districts. Former Gov. Eliot Spitzer rightly regards the Foundation Aid formula as one of his important legacies.
One of the goals of the Foundation Aid formula was to break rigid shares of School Aid directed to New York City, Long Island, and Rest of State, notwithstanding the fact that enrollment and financial need were growing more rapidly in New York than in any other part of the State. It was expected that the Foundation Aid formula would shift School Aid to New York City and other urban districts at the expense of the downstate suburbs.
What we did not anticipate at the time was the magnitude of the coming demographic shift that reduced enrollment in almost every school district but was especially pronounced upstate when combined with population loss. In order to ensure its enactment by what was then a Republican-controlled state Senate representing “Rest of State” districts, which even then were facing declining enrollment, the Foundation Aid formula included a “hold harmless” provision that required a certain level of School Aid even when the student population declined. The hold harmless provision was to become a major issue in the FY 25 Budget.
Although enactment of the Foundation Aid formula in 2007 seemed to conclude a long-running battle, the victory was short-lived. As a result of the financial crisis of 2008 and the sharp drop in State revenue during the Great Recession that followed, the Foundation Aid formula was not fully funded in the remaining years of what became the Paterson administration after Gov. Spitzer’s resignation in March 2008.
When Gov. Cuomo took office in 2011, he recognized that fully funding the Foundation Aid formula would make it impossible to limit overall growth in State Operating Funds to 2%. In its place, the FY 12 Budget enacted the “School Aid growth cap,” which limited the growth in School Aid to the annual rate of growth in State Personal Income, as calculated in the Personal Income Growth Index (PIGI). The statutory PIGI for School Aid is based on the average annual income growth over a ten-year period. Personal income growth at the time was growing at around 4% a year, so the rationale was that although School Aid would not be funded as required under the Foundation Aid formula, School Aid would still be growing at twice the average rate of growth in State Operating Funds.
The pressure of education advocates to fully fund the Foundation Aid formula remained strong throughout the years. In FY 22, the State committed to a three-year phase-in of fully funding the Foundation Aid formula. As described in the FY 25 Executive Budget: “Over the past three years, School Aid increases have substantially exceeded the PIGI, consistent with the State’s commitment to phase in full funding of the Foundation Aid formula. Driven primarily by the final year of this phase-in, the SY 2024 increase of $3.0 billion (9.4 percent) was substantially above the indexed PIGI rate of 4.2 percent.”
School Aid in the FY 25 Enacted Budget increased by approximately $1.3 billion to approximately $36 billion, which was approximately $700 million more than proposed in the Executive Budget. This growth rate of approximately 4.7% exceeded the indexed PIGI rate of 3.7 percent,[19] and total spending was higher than it would have been had School Aid growth remained within the PIGI since FY 22.
When the Foundation Aid formula was created in 2007, a relatively small number of school districts were affected by the hold harmless provision that states that the amount of School Aid cannot be less than the amount of funding in the prior year (plus an inflation factor). However, by FY 25, the ongoing decline in student enrollment due to demographic changes and population loss upstate meant that roughly half of school districts would see a reduction in School Aid under the Foundation Aid formula but for the existence of the hold harmless provision.
Gov. Hochul’s Executive Budget sought to tie School Aid more directly to actual enrollment by eliminating the hold harmless provision. Not surprisingly, the legislature rejected a change that would create so many losers within their districts. The FY 25 Enacted Budget does, however, direct the Rockefeller Institute of Government to study the Foundation Aid formula prior to the FY 26 Executive Budget with a view to suggesting reforms.
Statutory Debt Cap
Although budget watchdogs including the Office of the State Comptroller often suggest that State borrowing is excessive, Base Debt Service only accounts for approximately 5% of State Operating Funds spending. I could make the counterargument that in many, but not all, cases, the State should choose to invest more through debt-supported capital, even if it needs to spend less on current consumption than is reflected in recent trends. This would have been a better argument a few years ago before long-term interest rates surged closer to historical levels. In the current circumstances, however, a better fiscal strategy might be to use a significant portion of Budget reserves to fund investment programs, such as the Safety Net Hospital Transformation Fund, affordable housing, and other infrastructure projects that have long-term financial benefit.
The New York State Constitution does not include a limitation on the total amount of debt that State can borrow. However, does require that any State general obligation debt must receive voter approval through a ballot proposal. However, approximately 97% of the State’s debt is by State public authorities rather than directly by the State, a practice that needs to be known as “backdoor borrowing.”
The New York State Comptroller, Tom DiNapoli, argues that the statutory debt “has been rendered meaningless” because of backdoor borrowing and other statutory carveouts. He has proposed a constitutional amendment that would more strictly limit State borrowing and could not be overridden by statutory Budget provisions. Although this proposal for a constitutional amendment has never gained traction, his perspective is shared by other Budget watchdogs, and the statutory debt cap is perhaps the only fiscal framework in New York that has an ongoing impact on State policy.
New York adopted a statutory limit on State-supported debt in 2000. Because the New York State Constitution doesn’t include a debt limitation, the statutory debt cap can be “notwithstood” in the Budget process, as happened in FY 21 and FY 22 during the Covid-19 pandemic. The suspension of the debt cap ended in FY 23 and its existence continues to constrain the issuance of State-supported debt as a policy matter.
The provisions of the statutory debt cap are succinctly described in the FY 25 Executive Budget Financial Plan as follows:
“The Debt Reform Act of 2000 (“Debt Reform Act”) restricts the issuance of State-supported debt funding to capital purposes only and limits the maximum term of bonds to 30 years. The Debt Reform Act limits the amount of new State-supported debt to 4 percent of State personal income, and new State-supported debt service costs to 5 percent of All Funds receipts.
The restrictions apply to State-supported debt issued after April 1, 2000.
The Executive Budget Financial Plan offers a clear explanation of the statutory debt cap, as well as the table below which shows the amount of borrowing capacity available under the two statutory tests.

Table from p. 66: https://www.budget.ny.gov/pubs/archive/fy25/ex/fp/fy25fp-ex.pdf
The Financial Plan table shows that the test of debt outstanding as a percentage of personal income is the more stringent of the two tests. The second test, which measures debt service as a percentage of All Funds receipts, is flawed in two respects. First, it treats prepayments the same as required debt service payments. The table reproduced below from the FY 25 Executive Budget Financial Plan illustrates the extent to which prepayments distort the measurement of compliance with the state debt cap.

Table from p. 15: https://www.budget.ny.gov/pubs/archive/fy24/en/fy24en-fp.pdf
The second flaw in the statutory debt cap is that All Funds receipts is a misleading measure of debt service capacity because federal funding is not available for debt service. The second test would make more sense if it were measured as a percentage of State Operating Funds and included only base debt service, not prepayments. By that measure, debt service in FY 25 would be approximately 5.2% of State Operating funds.
It’s beyond the scope of this paper to more thoroughly examine not only possible reforms of statutory debt cap but also to define the State’s long-term strategy regarding the appropriate level of capital investment and long-term debt.
Conclusion
It is sometimes said that rules are made to be broken. Certainly, fiscal frameworks that limit spending need to be flexible enough to accommodate changing realities, such as extraordinary assistance to New York City for expenses related to asylum seekers. That said, the articulation of an explicit fiscal framework to guide spending is a crucial element of strategic thinking about New York State government. Having such a framework helps to clarify for the executive, the legislature, stakeholders, and the broader public the necessity of the trade-offs between current needs and the long-term fiscal health of the State.
A new fiscal framework for growth in State Operating Funds should begin with a somewhat revised construct that excludes items (such as SUNY tuition) that do not directly relate to State spending in the same way that tax-financed activities do. The 2% growth target may not be realistic in light of built-in inflationary factors, but it’s hard to justify having a spending target that is greater than the rolling 10-year average personal income growth, which currently is approximately 4%.
The current Medicaid Global Cap index that allows approximately 5.5% in annual growth is a reasonable target, but for it to create more meaningful guardrails around a sustainable growth trajectory for Medicaid spending, the Cap needs to apply to all State share Medicaid spending, including Medicaid spending by the “O” agencies and categories of spending that are currently excluded from the calculation. An updated Medicaid Global Cap should also establish parameters for growth in certain major categories of Medicaid spending (which could be more flexible than the overall Cap), including long-term care, hospital reimbursement, and primary care. All Funds Medicaid spending could grow at a faster rate than the Medicaid Global Cap to the extent that the State is able to pursue federal financial participation maximization strategies. To the extent that State spending related to the MCO tax is essentially recycled federal funding, it would be legitimate to exclude that spending from an updated Medicaid Global Cap.
It should be noted that Massachusetts and eight other states have enacted health expenditure spending growth targets or benchmarks for total healthcare spending in their states. We think the enforcement policies of some of the states, including Massachusetts, are ill-advised for New York. But having some type of benchmark that incorporates the issue of provider sustainability may be beneficial. We will be releasing a paper shortly that reviews these state health expenditure benchmarks and their potential relevance to New York State.
The FY 25 Enacted Budget postponed making changes to the Foundation Aid formula and instead charged the Rockefeller Institute of Government with proposing modifications before the next budget. The construct of the Foundation Aid formula should be used to determine the allocation of funding among school districts. However, it would make sense if the existing School Aid Growth Cap that is tied to the Personal Income Growth Index was restored as a limitation on total School Aid rather than a spending total determined by the funding formula for Foundation Aid.
Acknowledging that achievement of the legislative consensus necessary to maintain these limitations will be difficult does not mean that the exercise should not be attempted. Ultimately, only the executive branch is invested in restraining spending. Unless there is the exertion of a strong gravitational pull from the governor, the recent trends in spending growth will be difficult to reverse. The Hochul administration clearly recognizes the need to identify structural changes in the largest categories of State spending, which is the purpose behind the Future of Healthcare Commission and the Rockefeller Institute project regarding revisions to the Foundation Aid formula.
If there is a reconciling principle between the demands of current spending and the longer-term fiscal strength of the State, it may be in reorienting spending as much as possible towards investments that will credibly increase future State revenue and/or reduce operating expenses. We have suggested a few such initiatives in this paper. As the State gets closer to developing the FY 26 Executive Budget, our goal will be to identify more such opportunities.
Paul Francis
May 8, 2024
Paul Francis is the Chairman of the Step Two Policy Project. He served as the director of the Budget in 2007 and as the Deputy Secretary for Health and Human Services from 2015 – 2020, among other government positions. This note and other writings by the Step Two Policy Project are published on Substack and on the Step Two Policy website.
[1] A number of “good government” groups sent a letter to the Governor requesting that the Administration release more summary information about the Enacted Budget. Recognizing the need for DOB staff to fully process the Enacted Budget numbers, the lack of a comprehensive Financial Plan to supplement information from the Enacted Budget press release makes it difficult to do a completely accurate and timely analysis of the Enacted Budget.
[2] This estimate uses estimated FY 24 spending reported in the FY 25 Executive Budget and assumes that approximately $3 billion of the $4.5 billion increase in All Funds spending in the FY 25 Enacted Budget represents State Operating Funds.
[3] FY 25 Briefing Book, p. 19. https://www.budget.ny.gov/pubs/archive/fy25/ex/book/briefingbook.pdf
[4] https://www.economicsobservatory.com/what-are-fiscal-rules-and-how-have-they-worked-in-the-uk
[5] https://researchbriefings.files.parliament.uk/documents/CBP-9329/CBP-9329.pdf
[6] https://obr.uk/forecasts-in-depth/tax-by-tax-spend-by-spend/departmental-expenditure-limits/
[7] Note: this excludes spending on the NHS and pensioners’ payments. https://www.instituteforgovernment.org.uk/explainer/current-fiscal-rules
[8] See p. 24 https://dos.ny.gov/system/files/documents/2024/04/constitution-january-1-2024.pdf
[9] https://codes.findlaw.com/ny/state-finance-law/stf-sect-22.html
[10] For better or worse, I was the Budget Director who thought that State Operating Funds was a better measure for budget growth, because it included essentially all State-funded spending, excluding capital expenditures and debt service. I did not envision that growth in State Operating Funds would be used as an index of allowable Budget growth. The definition includes certain revenue and expense items, such as SUNY tuition and operating expenses, which don’t really reflect the taxing authority of the State. The definition of State Operating Funds could be improved upon.
[11] https://www.nyssba.org/advocacy-legislation/member-s-guide-to-nys-budget-process/
[12] We estimate that actual State Operating Funds spending in FY 2024 will be approximately $139 billion, which is based on the FY 2024 Executive Budget estimate of FY 2024 State Operating Funds spending of $136 billion plus an additional $3 billion in State Operating Funds spending that we estimate was added in the FY 2025 Enacted Budget.
[13] Personal Income values from U.S. Bureau of Economic Analysis, “SASUMMARY State annual summary statistics: personal income, GDP, consumer spending, price indexes, and employment” (accessed Wednesday, April 24, 2024).
[14] The table compares personal income for the calendar years shown to reported actual taxes for the fiscal year beginning in the calendar year shown.
[15] Average of percent increase in actual State Operating Funds reported in FY 2024 Enacted Budget Report, estimated State Operating Funds in the FY 25 Executive Budget adjusted for estimated increase in spending through negotiations, and forecasted FY 2025 spending as reflected in the FY 25 Enacted Budget Press Release.
[16] See p.111: https://www.budget.ny.gov/pubs/archive/fy25/ex/fp/fy25fp-ex.pdf
[17] See p.68: https://www.budget.ny.gov/pubs/archive/fy25/ex/book/briefingbook.pdf
[18] Because State spending associated with the MCO tax is essentially recycled federal funding, there is a strong rationale for not including it in a measure like the Medicaid Global Cap that is designed to limit State share Medicaid spending, not total Medicaid spending.
[19] See p. 59: https://www.budget.ny.gov/pubs/archive/fy25/ex/fp/fy25fp-ex.pdf